Getting the most out of the EDA
When using the EDA, a sequence of steps can be followed to get the most of the support available. This sequence is presented as a suggestion, it is not meant to be prescriptive as every experiment is different. It is intended to serve as an aide mémoire when using the EDA.
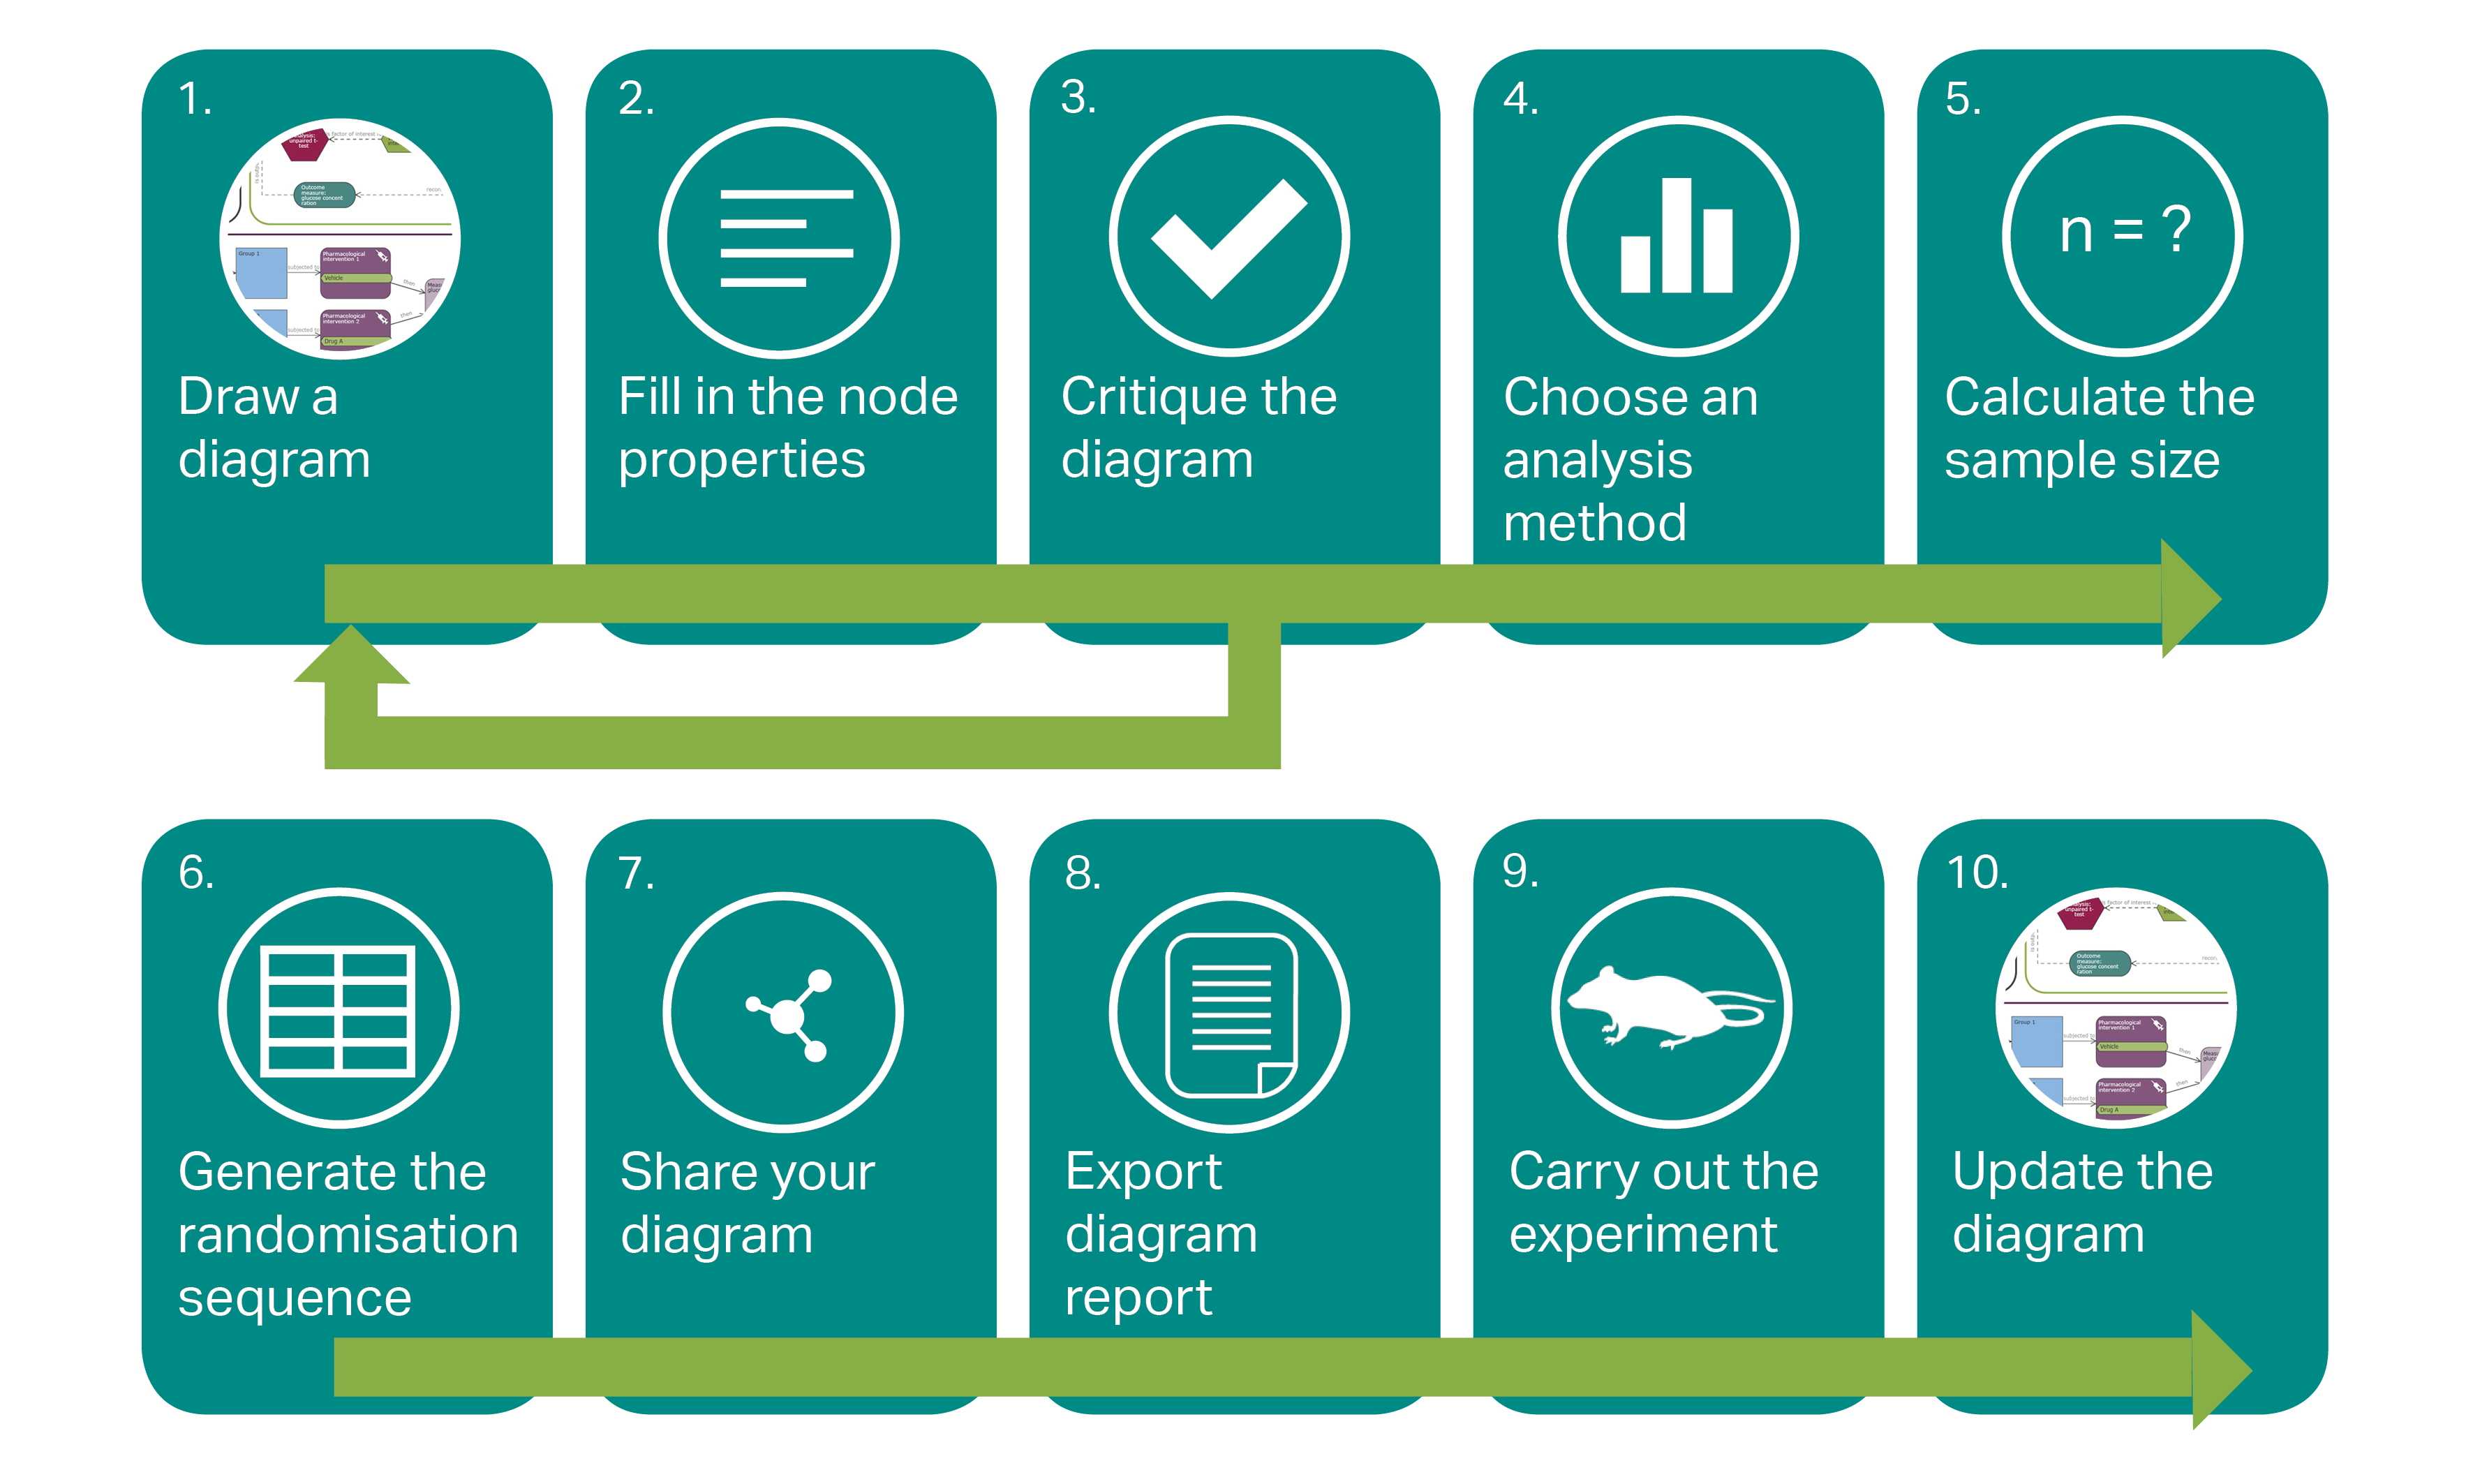
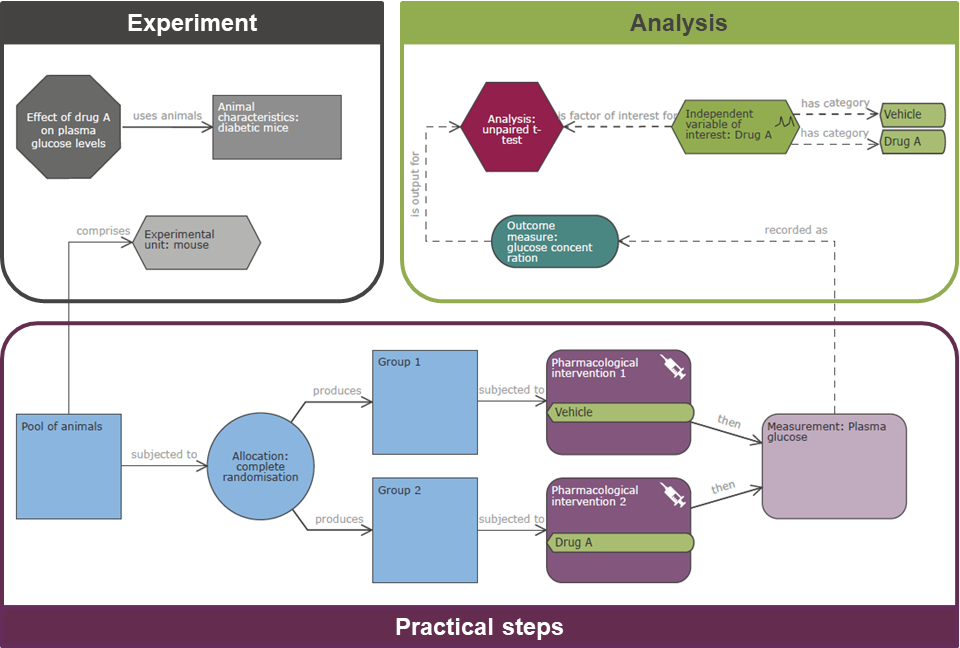
1. Draw a diagram
Diagrams are constituted of three parts, each representing different aspects of the design:
- Experiment – provides information about the objective and the characteristics of the animals used.
- Practical steps – represents the main part of the experiment, with the practical steps carried out in the lab.
- Analysis – includes the analysis, data processing and variables.
General information about the diagram can be found here and technical information on how to build it can be found here. Specific information about each node can be accessed from the information boxes in the palette.
2. Fill in the node properties 
The properties of each node on the diagram contain further information about the step represented. Some of this information is used by the critique function.
Specific information about each node and its properties can be found in the help centre (available when you are logged in).
3. Critique the diagram  and improve your design
The critique function provides feedback and advice, prompting you to analyse and review your experimental plan.
Click here for information about the critique function.
The diagram – thus the experimental plan – will evolve based on the feedback. This is an iterative process and this step and the previous one may be repeated several times as the feedback from the critique will change when the diagram is changed.
4. Choose an analysis method 
Once the feedback has been dealt with and enough information is included on the diagram, generate a suggestion of statistical tests which are compatible with the design of the experiment.
Find more information about the analysis here.
5. Calculate the sample size
Once the method of analysis has been chosen, the sample size can be estimated, using the appropriate power calculation. Note that information entered in the power calculation tabs will not be saved with the diagram, it is only used for the calculation. Once the sample size needed is known, the diagram can be updated with the number of animals and experimental units needed per group.
Refer to the guidance on sample size here.
6. Generate the randomisation sequence 
Based on the animal numbers indicated in the properties of each group node, the system can generate the randomisation sequence. It should not be generated until the plan for analysis has been finalised, as the inclusion of for example blocking factors will impact on the randomisation sequence. The randomisation sequence should be emailed to the person in charge of coding or administering the treatments so that the experimenter is unaware of the group allocation during the conduct of the experiment and analysis of the data.
Find more information about the randomisation spreadsheet here.
7. Share your diagram 
Share the diagram with your colleagues or collaborators, so that they can review your experimental plan.
8. Export an EDA report 
Export a PDF report, which contains key information about the internal validity of the experiment, a summary of the feedback from the system, and the EDA diagram itself. This report can be submitted as part of a grant application, as part of the ethical review process, or, later on, with a journal manuscript.
9. Carry out the experiment
Once every aspect of the design is finalised the experiment can be carried out.
10. Update the diagram
Upon data examination, the planned analysis method may not be deemed appropriate any more. The diagram can then be updated with the method of analysis actually used, and the reason for deviating from the plan. The number of animals per group might also vary from the sample size estimated at the start; the actual number of experimental units per group can be added to the diagram, with an explanation as to why planned and actual numbers differ.